Wednesday, April 24, 2013

What Was the Dead-Ball Era?

When you watch any baseball shows and they reference the history of baseball, the term "Dead-Ball Era" will probably come up. But what is it? What made it that way? Why did it end?

The Dead-Ball Era's official beginning and ending dates aren't completely agreed upon, but most will agree that the period between 1900 and 1920 is for sure part of the era. What made this era unique is the low amount of hitting that occurred. The emphasis in baseball was 'small ball' or not power hitting. For example, there was emphasis on steals and the hit-and-run.

It was during this period when you would see things that you would never see today. In 13 times during this era, the league leader in home runs had less than 10 for the season. On the other hand, there were 20 times when the league leader in triples was 20 or more. Two of baseball's most unbreakable records were set during this time: Owen "Chief" Wilson's 36 triple season in 1912, and Sam Crawford's career 309 triples. The average league BA (batting average) was as low as .239 in some seasons (1907-08), and the average ERA (earned run average) was at times under 2.40 (1907-08). In 1908, the White Sox had only 3 home runs for the entire season, but they finished 1 1/2 games out of first with a record of 88-64. After numerous complaints, the cork-centered ball was introduced in 1910, and the league BA jumped dramatically to.273 by 1912. The only exceptions to this era's low hitting were Ty Cobb and "Shoeless" Joe Jackson, both of whom had over a .400 BA in 1911 (and Cobb again had one in 1912), making these the only over .400 BA seasons from 1902-19. By 1913, the pitchers adapted and again the BA dropped across the league. It's during this era when we see odd things like Frank Baker who was nicknamed "Home Run" Baker because he hit two home runs in the 1911 World Series, and even though he led the league in home runs from 1911-14, his season high was only 12 (1913), and he finished his career with only 96.

So, what made it so low-scoring, and how did it change? There are many answers, and the truth is most likely a combination of them all.
  1. Introduction of the foul-strike rule: The NL adopted a rule in 1901 (the AL did so in 1903) that made a foul ball count as a strike unless you have two strikes on you already (the exception being a bunt). Before then, a foul didn't count against you in any way. This rule still exists today.
  2. Ballpark dimensions: The ballparks were huge back then. The Boston Red Sox played at the Huntington Avenue Grounds, and it was 635 feet to center field. The Chicago Cubs played at the West Side Grounds, and it 560 field to center field. Even the Polo Grounds (which housed several teams) which boasted close corners (left field distance of only 279 feet, and right field distance of 258 feet) had a center field distance of 483 feet.
  3. The use of the ball: It was common for a ball to be left in play for over 100 pitches, or until the ball started to unravel. The longer the ball was in use, the softer it became, which made it harder to hit for power. Also, balls hit out of play had to be returned to the field of play.
  4. The spitball: Around 1913, Russ Ford discovered that if you scuffed the ball, it would do some dramatic things when pitched. Add in some dirt, spit, tobacco juice, and you have the spitball. Not only would the ball change direction much more dramatically, it was also hard to see. Pitchers used this pitch to great effect for the last part of the Dead-Ball Era.
So how did it end? There is no one answer, but if you add up all that changed between 1919-1921, you will see what caused the changes.
  1. More balls per game: After the 1920 season, a rule was enacted that when a ball became dirty that a new ball be used.
  2. The spitball banned: In 1920 the spitball was outlawed. The MLB did realize that some pitchers made their careers using it, so 17 pitchers were allowed to throw it for the rest of their career; the last pitcher to do it legally in the MLB was Burleigh Grimes in 1934.
  3. Game-winning home runs: In 1920, a rule was enacted that when a walk-off home run occurred, then the stat counted whether the runs were all needed or not. Before this, if you were tied and had a man on first and you hit a home run, then you would get credit for the RBI and not the Home Run or the second RBI.
  4. The fair-foul pole: Also in 1920 a rule was created so that if you hit a home run that was fair when it went over the fence but "curved" around the foul pole and landed on the foul side then it was still a home run. Before, your home run had to land in the fair part of area past the fence.
  5. Stats in protested games: And also in 1920 a rule was created so that games played under protest would have their stats added to the books. In the previous decade, games played under protest had their stats not counted.
  6. Babe Ruth: In 1919, Babe Ruth hit a league record of 29 home runs; in 1920, it was 54; in 1921, it was 59. His approach to hitting changed some other's mentality of how to hit. Before, the goal was to get on base or move the runner, so you wanted to angle your bat down. Ruth hit the balls with an upper switch which would lift the balls. If done with power behind the swing, then the balls would go out and be a home run. His approach was to hit a home run as opposed to just the old small-ball mentality.
If you add these together, you have the end of the Dead-Ball Era and you have what became known as the Live-Ball Era.

Wednesday, April 17, 2013

Where Is the Mason-Dixon Line?

I bet you've heard of the Mason-Dixon Line, but I bet you don't completely know what it is. Today, people think of the famous line as the border between the North and South, dating back to the days of the Civil War. However, the line actually dates back almost a century before the Civil War, and what caused the line to be made dates to a century before that.

The story of the line goes all the way back to the early 1600's. First there was the colony of Maryland. The original charter stated that the northern border of Maryland was at the 40th Parallel. However, when the king granted a charter to William Penn and his colony of Pennsylvania, the problem arose when neither Pennsylvania or Maryland could agree. Maryland thought their northern border was high enough to include the growing Philadelphia, and Pennsylvania thought their southern border was much more south than Philadelphia. A treaty was signed in 1682, which defined the borders for Maryland and Pennsylvania. This might have ended the controversy, but some land that was originally part of Maryland's charter went to William Penn. This land soon became the Delaware colony.

Mason-Dixon Line
Another treaty was signed in 1732 between Penn's sons and Charles Calvert (Maryland's provisional governor) which defined the border. Calvert soon chose not to follow the 1732 treaty, claiming that he didn't agree to things in the treaty. Violence broke out between people claiming to be part of Maryland vs Pennsylvania. The crown finally intervened and in 1760 forced Maryland to accept the 1732 borders. This border was defined as 15 miles south of the southernmost house in Philadelphia.

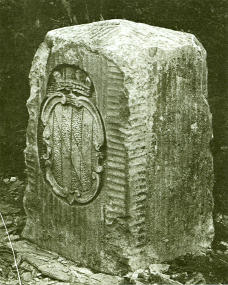
Mason-Dixon Crownstone
As part of the agreement, the Penns of Pennsylvania and the Calverts of Maryland commissioned a pair of English surveyors to officially map out the exact borders of Pennsylvania, Maryland, and Delaware. Who were these two men? Charles Mason and Jeremiah Dixon. They began work in 1763, and began surveying in 1765. They completed in 1767. They marked the border with crownstones (some of which still exist today).

The Delaware Wedge
Part of the survey planning involved what's called a "12-mile circle" around the city of New Castle, Delaware, which provided the rounded top border of Delaware. This left a small wedge of land that was shown not to belong to Maryland due to the Mason-Dixon Line, but because of the circle, it should belong to Pennsylvania. However, Delaware claimed that the Mason-Dixon Line didn't go east enough to cover this wedge of land. Pennsylvania and Delaware fought over this sliver of land until 1921 when it was established to be Delaware's.

Wednesday, April 10, 2013

Untold Stories about the McRib Sandwich

Chances are you've either had a McRib Sandwich or you at least know what it is. This sandwich has gained a cult following all to itself over the last thirty years. McDonald's, the marketing and food powerhouse that it is, introduced the sandwich back in 1981 to a rave audience. However, the sandwich disappeared in 1985. It wasn't until the mid-90's that this beloved sandwich made a return to McDonald's restaurants, but this time there was a catch: it was only available for a limited time. So, what's the deal with this sandwich? Well, here's more of the story about the McDonald's sandwich that caused a unique following, and also info that may make you think twice about having it.


The McRib Sandwich was created as an alternate food item to help the overburdened poultry industry. Yes, that's correct. In 1979, the Chicken McNugget was introduced, and demand was more than anticipated. In fact, demand for the McNugget was so intense that the American poultry market had too much strain, so McDonald's came up with a different food item other than beef and chicken. What naturally would that be? Pork!

After a trip to South Carolina, McDonald's executive chef was inspired by the southern bbq of the area. He chose to model the new sandwich to look like pork ribs. But of course, there can't be bones in a sandwich, much less a fast food sandwich. So, McDonald's created the shape of the McRib using what is called "restructured meat technology". This technology takes heart, tripe, and scalded stomach and mixes it with salt and water to extract proteins from the muscles. These proteins allow the meat to be molded into any shape that is desired. In the case of this sandwich, the desired shape was a fake slab of ribs. Interestingly enough, the process from pork to frozen McRib sandwich (yes, they are flash-frozen at the plant and transported to the restaurant) takes about 45 minutes.

If that isn't enough to make you think twice about the sandwich, think about what's in it. Did you know that there are 70 ingredients in the sandwich, 35 of which are in the bun alone? Two of the most interesting/alarming ingredients are azodicarbonamide and ammonium sulfate.If you're not familiar with these, don't be surprised. But I bet you know what else they're used in. Ammonium sulfate's most common use is in soil fertilizer. Azodicarbonamide is a flour-bleaching agent that's also used in yoga mats. And if that doesn't change your mind, just think of the nutritional information: 500 calories, 26 grams of fat, 44 grams of carbs, and 980 milligrams of sodium.

So, what's the big deal with the sandwich? It's a piece of marketing genius. Ever since the McRib came back in a limited supply in the mid-90's, random McDonald's across the US have periodically offered the sandwich for a limited time. This caused an uproar from people who wanted it. It has spawned a website to track where you can find the sandwich at any given time. By not having the sandwich available at all times, demand for the sandwich is always high, which keeps the cult of the McRib going.

If you are still a fan of the McRib, then have fun! Maybe it's coming to a McDonald's near you soon.Keep in mind that the franchise owner can order the McRib almost anytime, so keep checking to see when they will offer the sandwich again.

Wednesday, April 3, 2013

Bracket Odds

Now that March Madness is nearly over, people all across the country are either hopeful about their brackets or have already thrown in the towel. For those of you (like myself) whose brackets are completely rubbish after the multitude of upsets this year, fear not. You're not alone. To make you feel better, here are some stats on how unlikely it is you will get a perfect bracket.

First you have to figure out how to find out what the odds are of getting a perfect bracket. The way you have to look at it is if you have a 4 team bracket (Team A vs. Team B, Team C vs. Team D), then you will have two winners and two losers. That means that on each side, you have two possible outcomes: Team A could win or Team B could win, and Team C could win or Team D could win. So, two possibilities on the left, and two possibilities on the right, which you multiply together for a total of 4 possible ways the final matchup could be. Then when you have the winner of both sides, you again have a possibility of two scenarios: the winner of the left will win, or the winner of the right will win. So you multiply the 4 possibilities from the left and right brackets by the 2 possibilities in the final matchup, which leaves you with 8. What does that mean? It means that if you have a 4 team bracket, you have a 1 in 8 chance of picking the winner. The shorter way of figuring it out if that of the 4 teams, 3 will fail. Each failure has 2 possibilities of who will win, so you multiply 2 three times, or 2 x 2 x 2, which still equals 8.

So how does this work with a bracket containing 64 teams? In the same way. Out of 64 teams, 63 will lose. Each matchup has 2 possibilities, so you mutiply 2 times itself 63 times, one time for each loser. Do you have any idea how big of a number 2 times itself 63 times is? 9,223,372,036,854,775,808, or what mathematicians call 9.2 quin-trillion. So, essentially, you have a 1 in 9.2 quin-trillion chance of filling out a perfect bracket. That's just the sheer math of it. If you know some about basketball, you have shave off a bit of that, but your odds still aren't that good. So, knowing how unlikely it is to fill out a perfect bracket, are you curious about the sheer facts about this huge number?
  1. If everyone on the planet each randomly filled out a bracket, the odds would be 1,000,000,000 (1 billion) to 1 of anyone having a perfect bracket.
  2. If 1 bracket per second were filled out, it would take 292,000,000,000,000 (292 trillion) years to fill out all possible brackets.
  3. If everyone on the planet filled out a bracket per second, it would take 43 years to fill out every possible bracket.
  4. If all possible brackets were stacked on top of each other on regular paper, it would reach from the earth to the moon and back 1.1 million times.
  5. If you weighed all possible brackets that are on regular paper, they would weigh approximately 90,000 times heavier than every person on earth combined. 
Also, keep in mind that if you had a 90% chance of picking the correct games, your odds of filling the rest out correct would be 763 to 1. 

So if you're feeling low because your brackets have failed, don't worry. You're definitely in good company with the other 9.2 quin-trillion of chances!